How to download and try this example
Usage: pl -gif hbars1.htm
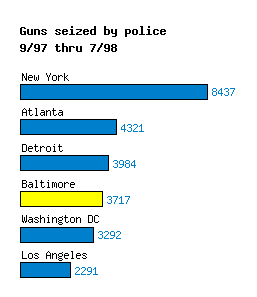
Source: Bureau of Alcohol, Tobacco, and Firearms.


// specify data using proc getdata
#proc getdata
data:
	"New York"	8437
	"Atlanta"	4321
	"Detroit"	3984
	"Baltimore"	3717
	"Washington DC"	3292
	"Los Angeles"	2291

// set up plotting area using proc areadef
#proc areadef
  title: Guns seized by police\n9/97 thru 7/98
  rectangle: 1 1 3 3.5
  yrange: 0 7
  xrange: 0 9000


// render bars using proc bars
#proc bars
  horizontalbars: yes
  color: rgb(0,0.5,0.8)
  lenfield: 2
  barwidth: 0.15
  labeldetails: adjust=0,-0.03 color=rgb(0,0.5,0.8)
  colorlist: 4 yellow
  showvalues: yes

// render yaxis last so it is not obliterated, using proc yaxis
#proc yaxis:
  stubs: datafields 1
  tics: none
  axisline: none
  stubdetails: align=L  adjust=0.17,0.15