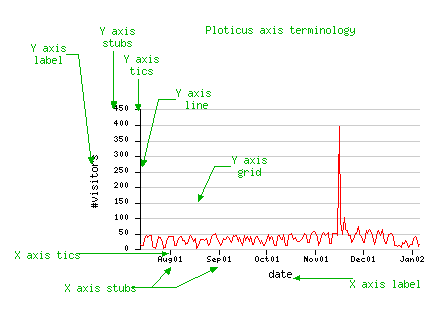
// simple example 2

#proc getdata
file: ../pltestsuite/data19
fieldnames: count dt

#proc areadef
rectangle: 2 2 6 4
xscaletype: date mmddyy
xautorange: datafield=dt
yautorange: datafield=count incmult=2.0 lowfix=0
xaxis.label: date
xaxis.stubs: inc 1 month
xaxis.stubformat: Mmmyy

yaxis.label: #visitors
yaxis.stubs: inc
yaxis.labeldetails: adjust=-.2,0
yaxis.grid: color=gray(0.8)

#proc lineplot
xfield: dt
yfield: count
linedetails: color=red


// now add annotations

#proc annotate
location: 0.68 4.82667
arrowhead: 1.30667 3.24
textdetails: color=green
arrowdetails: color=green
text:	Y axis
	label

#proc annotate
location: 1.66667 5.06667
arrowhead: 1.62667 4.02667
textdetails: color=green
arrowdetails: color=green
text:   Y axis
	stubs

#proc annotate
location: 2.01333 4.66667
arrowhead: 1.97333 3.98667
textdetails: color=green
arrowdetails: color=green
text:   Y axis
	tics

#proc annotate
location: 2.8 4.18667
arrowhead: 2.04 3.2
textdetails: color=green
arrowdetails: color=green
text:   Y axis
	line

#proc annotate
location: 3.56 3.22667
arrowhead:  2.84 2.69333
textdetails: color=green
arrowdetails: color=green
text:   Y axis
	grid


#proc annotate
location: 0.666667 1.86667
arrowhead: 2.41333 1.94667
textdetails: color=green
arrowdetails: color=green
text:   X axis tics

#proc annotate
location: 1.42667 1.4
arrowhead: 2.44 1.74667
arrowhead2:  3.10667 1.74667
textdetails: color=green
arrowdetails: color=green
text:	X axis stubs

#proc annotate
location: 5.5 1.45333
arrowhead: 4.18667 1.6
textdetails: color=green
arrowdetails: color=green
text:  X axis label

#proc annotate
location: 4 5.08
textdetails: color=green size=12
text: Ploticus axis terminology