How to download and try this example
Usage: pl -gif timeline1a.htm Same as timeline1.htm but different colored bars...
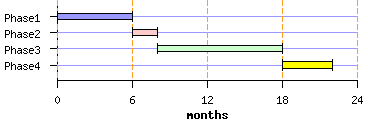
// Specify data using proc getdata #proc getdata data: Phase1 0 6 Phase2 6 8 Phase3 8 18 Phase4 18 22 // Define plotting are using proc areadef #proc areadef rectangle: 1 1 4 1.8 xrange: 0 24 yscaletype: categories ycategories: datafield 1 // Define yaxis using proc yaxis #proc yaxis stubs: categories grid: color=powderblue // Define xaxis using proc xaxis #proc xaxis stubs: inc 6 grid: color=orange style=2 label: months // Render the bars using proc bars // with segmentfields and tails // ..once per color.. #proc bars // color: powderblue axis: x locfield: 1 segmentfields: 2 3 barwidth: 0.06 tails: 0.1 // colorlist: powderblue pink rgb(0.8,1,0.8) yellow colorlist: powderblue pink rgb(0.8,1,0.8) #saveas: B