 Search
Ploticus >
Scripts >
Examples >
| Script examples gallery - Annotation |
|
Ploticus includes a facility for including labels,
and arrows. While obviously not the strong suit of a batch-oriented
program, proc annotate can render text,
one or two arrows with semi-intelligent placement, and a backing
box if desired. Clickmap support
is available for annotations.
|
Example 1
annot1

This example has an annotation with location expressed in
scaled units.
Example 2
annot2

Another example, showing various options.
Example 3
clickmap_annot

This illustrates clickmap support for annotations. Try clicking
on any of the boxes above..
Example 4
rangesweep1

Annotations done in vertical text.
Example 5
button

Proc annotate may also be used to create buttons for web pages.
Example 6
annot_circ

Annotations can be enclosed in ellipses or circles.
Example 7
devol

Proc annotate can be used to circle noteworthy graph areas.
Example 8
mockup

An example of a long annotation.
Example 9

|
Click here to see script source.
An example where proc annotate was used to create a simple
E-R diagram for a database. Entity bubbles support text annotation
that appears when the mouse hovers over them, and click-thru to
actual database table documentation. Try hovering the mouse
pointer over an entity bubble, and then click on the bubble.
This was somewhat tedious to code, since all locations were hard-coded,
and the order in which bubbles and arrows are rendered is important for
clean arrow ends.
|
Example 10
simple2annot

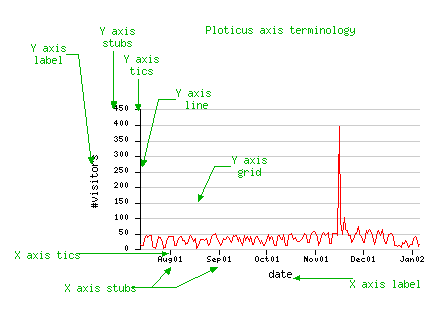
Using annotation to illustrate axis terminology.
|


