Click here to see examples
|
Scaling and axes,
the preliminaries to plotting data.
|
| |
Click here to see examples
|
Line plots
are used to show values that change from left to right.
Often the change is over time along the X (horizontal) axis.
Use proc lineplot.
|
| |
Click here to see examples
|
Filled Line Plots ...
Use proc lineplot with the fill option.
|
| |
Click here to see example
|
Category line plots
display individual lineplots, one per category in X.
Useful in comparing various entities, each of which have a displayable curve.

|
| |
Click here to see examples
|
Range Sweeps
may be used to depict ranges that change from left to right.
Often the change is over time along the X (horizontal) axis.
Use proc rangesweep.
|
| |
Click here to see examples
|
Pie Graphs
may be used to depict proportions that make up a whole, such as
budget categories, or survey breakdowns.
Use proc pie.
|
| |
Click here to see examples
|
Bar Graphs
(histograms) may be used to show comparisons, distributions, or category
tabulations. They are also sometimes used to show values that
change over time.
Use proc bars.
|
| |
Click here to see examples
|
Horizontal bars
are useful for compactness or where time values are being compared.
Use proc bars with
the horizontalbars option.
|
| |
Click here to see examples
|
Timelines
are used to display events and durations with respect to time.
The result may be in the form of a timetable, project progress chart, etc.
Use proc bars with the
horizontalbars and segmentfields attributes.
|
| |
Click here to see example
|
Floating bar segments
can be used to represent many things including time interval events or genomic regions.
Use proc bars with the
horizontalbars and segmentfields attributes.
|
| |
Click here to see examples
|
Bar proportions
Use proc bars with the
stackfields option.
(A pie graph can also be used to show proportions.)
|
| |
Click here to see examples
|
Scatter plots
display data points in one or two dimensions. Every data
point is plotted with a mark, symbol, or label.
2-D scatterplots are often used to show correlation (or lack thereof)
between two variables.
Use proc scatterplot.
|
| |

Click here to see examples
|
Heat maps / density grids
use color to indicate frequency in a two-dimensional distribution.
These are created using proc scatterplot features.
|
| |
Click here to see examples
|
Single variable distributions
show the distribution of one variable.
Lines, symbols, characters or text may be used to mark points.
Use proc scatterplot.
|
| |
| |
Click here to see examples
|
Error bars
show the amount of margin of error for a value. This usually is
+/- the standard deviation. If the amount of error has been calculated in
advance, use proc bars. If you want
ploticus to compute the mean and standard deviation, use
proc rangebar with the meanmode option.
|
| |
Click here to see examples
|
Curve fitting
involves generating a curve to see trends, averages, correlations, etc.
proc curvefit can generate
moving average, bspline, regression, and interpolation curves.
|
| |
Click here to see examples
|
Vector plots
can display 4 or 5 variables (x, y, direction, length, and perhaps color).
A variation of these is windbarbs, for use in weather charts.
|
| |
Click here to see example
|
Venn diagrams
can be used to show relationships between sets.
To create a Venn diagram invoke proc venndisk once for every disk in the diagram.
|
| |
Click here to see example
|
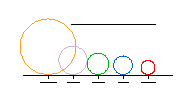
Venn magnitude charts
can be used to compare magnitudes, and allow compact representation
when a few of the values are much larger than the others.
Use proc venndisk.
|
| |
Click here to see example
|
Tree diagrams
can be generated using an input file in "newick" format.
|
| |
Click here to see examples
|
Legends
are necessary
when different symbols, colored bars, colored lines, etc. are
used for comparison.
Use the legendlabel attribute of each plotting
proc, then use proc legend to render the legend.
|
| |
Click here to see examples
|
Annotation
may be used to denote specific points or regions on a plot
that have some importance, or for any text placement.
Use proc annotate.
|
| |
Click here to see examples
|
Clickmap and mouseover support -
Clickmaps (image maps) allow a browser user to click with the mouse
on an object or region in a graph as a hyperlink to a new web page.
Mouseover support allows a browser user to move the mouse over a data point or region
and see a popup text label, in order to get additional information.
|